hvEPDnew, the Hordeum vulgare (barley) curated promoter database
|
|

Promoter Selection and Analysis tools
Various tools allow you to analyse promoters from EPD and/or to select subsets of promoters. In order to analyze the complete EPD promoter set, go directly to one of the analysis pages. If you prefer to first select a subset of promoters, go to one of the selection pages. From the output of the selection pages you can then directly navigate to one of the analyses pages, or you can continue with another selection page to refine your promoter selection.
Selection tools
|
Analysis tools
|
| How-To Documentation: OProf, FindM and ChIP-Cor. |
Database quality control
Core promoter elements' enrichment
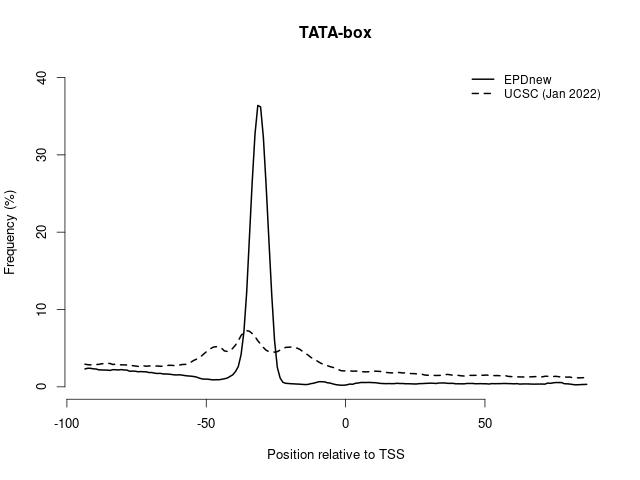
Core promoter element analysis is performed in order to investigate the quality of the promoter collection. It leverages the preferential occurrence of certain DNA motifs at characteristic distances from the TSS. For instance, TATA boxes occur in a narrow region centered about 30 bp upstream of the TSS, whereas the GGCCA motif occurs in a much wider area, with a maximal frequency at position -75. Based on these observations, a high-quality promoter collection is expected to show high peaks for both motifs. In addition, a narrow TATA box peak at -30 would indicate precise TSS mapping. This analysis has been performed using OProf. EPD users are encouraged to repeat this analysis and to perform others in order to check the quality of the promoter list.
TATA box: this core promoter element is normally found around 30 bp upstream of the TSS in plants. The following plot shows that the EPDnew promoter collection has a more focused TATA-box distribution compared to RefSeq/UCSC annotation suggesting a precise TSS mapping in EPDnew.
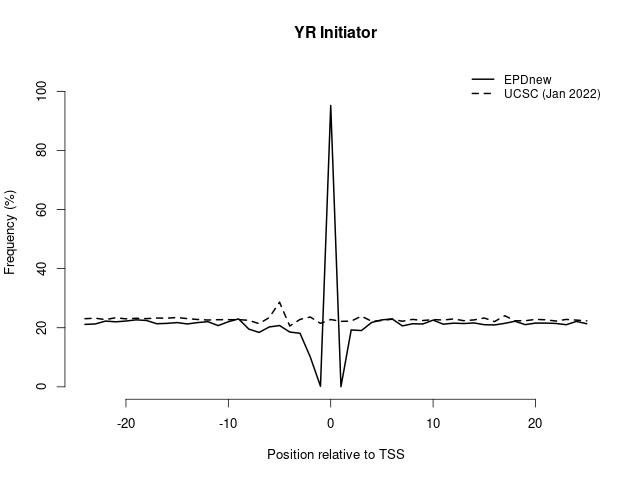
Basic YR initiator (consensus sequence YR): R is found exatcly at the TSS.
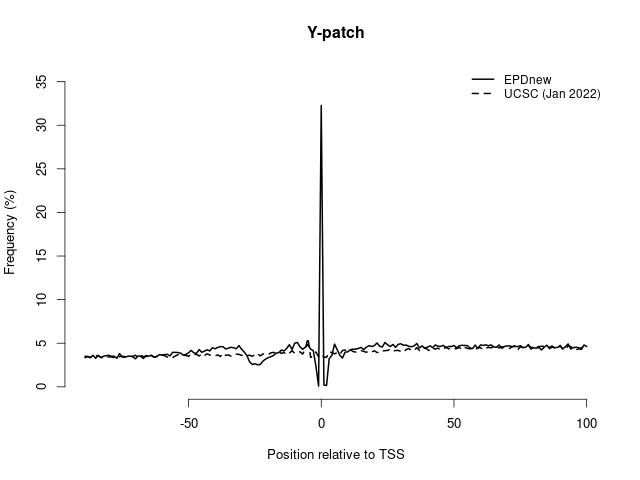
Y-patch: It consists of an array of Y (C/T) nucleotides. The last position of the motif contains an R (A/G) nucleotide and corresponds exactly to the TSS. This motif, which primarily occurs in plants, was first described by Yamamoto et al. BMC Genomics, 2007.
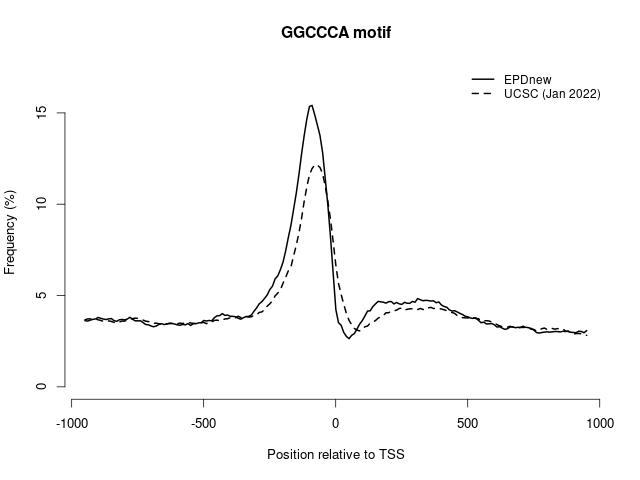
GGCCCA motif (exact match): this hexamer is highly enriched in plant promoters between 150 to 50 bp upstream of the TSS.